My row house has solar panels, as I’ve written about before, and they have had issues a couple times. The first was 2 years ago, when a single panel that stopped producing power for about a month. Late last month the whole system went offline, this time for just a couple days. During both of those times the otherwise terrific Enphase system didn’t bother to notify me, it took a while for me to become aware of the first issue, for the second I’d setup my own alarms.
I have recieved emails from Enphase about my solar generation, the “monthly summary” email is how noticed the first issue. Some, or all, of my system being offline however is not something they email you about, so I built that alert myself.
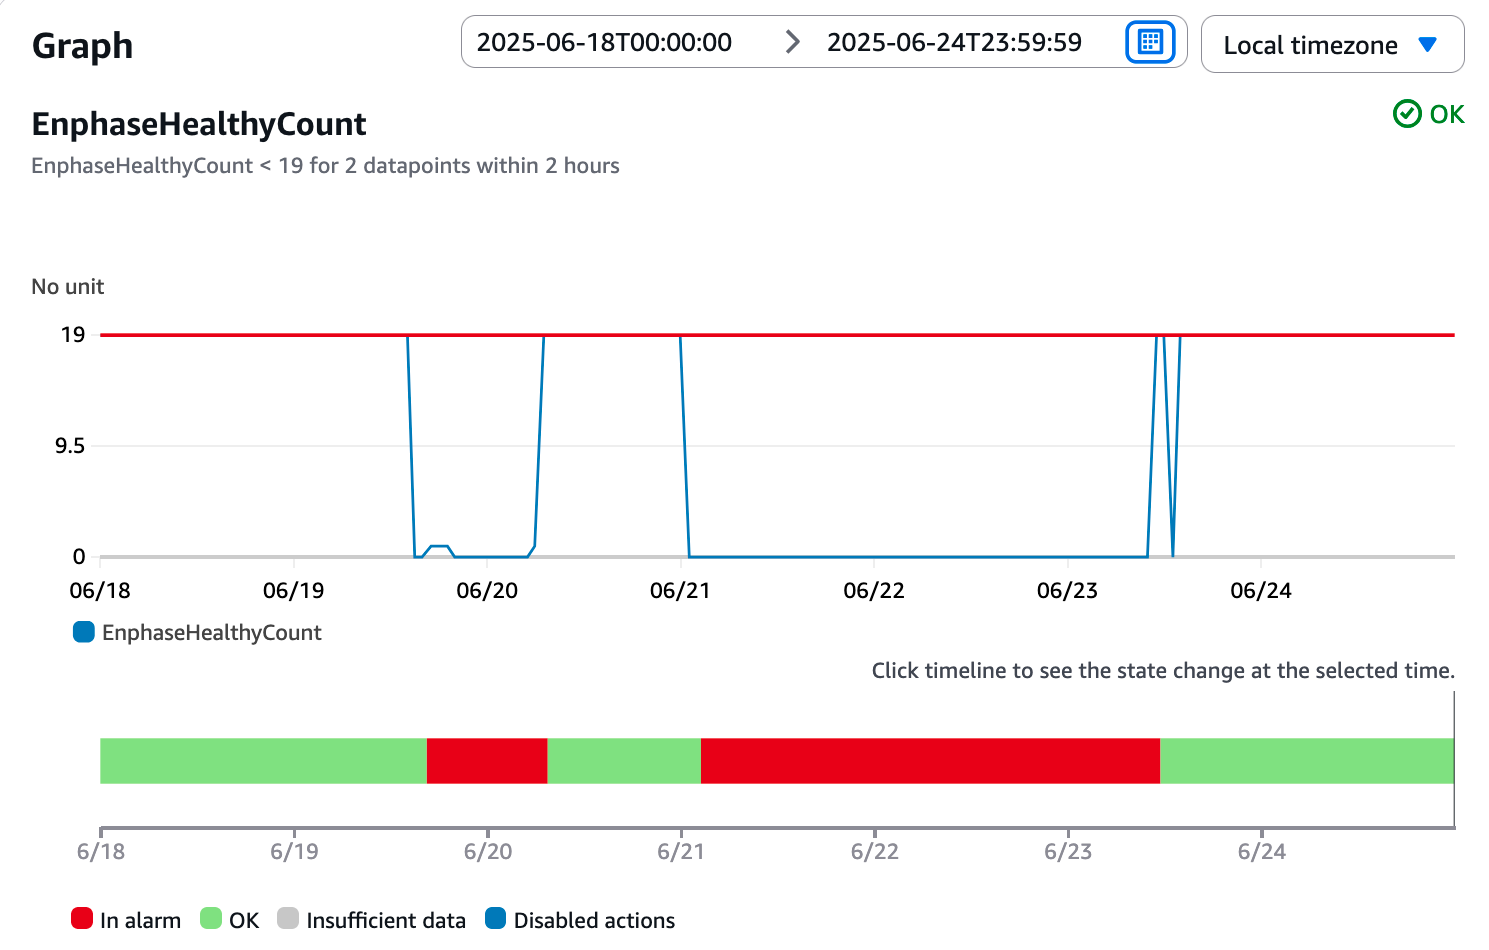
To create my own alerts I used Enphase’s Enlighten API, which lets you fetch information about a site, it’s installed devices and their generation. Specifically I’m fetching the status of the micro-inverters, counting the ones that are in a “normal” state and then sending that count up to AWS CloudWatch every 30 minutes. In Cloudwatch I configured an alarm so that if the number of healthy micro-inverters drops I’ll get an alert. It works like a charm.
The code to query Enlighten and post to CloudWatch runs on a Ubuntu machine I’ve got tucked away in a closet. It’s nothing special, has backups of photos, Plex installed to serve my collection of mp3s and a couple cron jobs. One of which is this script that checks that all my micro-inverters are healthy.
MAILTO=""
30 * * * * /var/local/cron/enphase_report.sh
The actual script that this runs is mostly holding the various identifiers and access credentials needed to make calls to one API and then ferry results over to the other.
#!/bin/sh
set -e

export ENPHASE_SYSTEM_ID=<SYSTEM_ID>
export ENPHASE_CLIENT_ID=<CLIENT_ID>
export ENPHASE_CLIENT_SECRET=<SECRET>
export ENPHASE_API_KEY=<KEY>

wd=$(pwd)
cd /path/to/pwrbrd
count=$(/path/to/pwrbrd/.venv/bin/python /path/to/pwrbrd/enphase_status.py)
cd $wd

export AWS_REGION=<REGION>
export AWS_DEFAULT_REGION=<REGION>
export AWS_ACCESS_KEY_ID=<ID>
export AWS_SECRET_ACCESS_KEY=<KEY>

aws cloudwatch put-metric-data \
        --namespace HomeNetwork \
        --metric-name EnphaseHealthyCount \
        --value $count \
        --dimensions DeviceType=micros
The python code which does queries the Enlighten API is in a somewhat abandoned project I’d been calling “Power Bird”, thinking of those birds that sit on power lines and just observe the world. I was hoping to use the Enlighten API along side info from Pepco, the electric utility here in DC, to build a kinda real-time view of how my house uses and produces electricity. Unfortunately getting data from Pepco is not anywhere near real-time, it seemed always to be like a day behind.
As a dashboard project I abandoned pwrbrd because I could not get recent usage data from Pepco. However, I did come away from the attempt with the code to walk the authorization flows for both systems and some helpers for making API calls. Exactly what I needed for my custom monitoring. At this point the git repository is in a mild state of disrepair, but the Enlighten client is running code that I use everyday.
I’m still a little disappointed that Enphase doesn’t just alert me when things are not online, but at this point my solution has been working well. The recent outage was a blown fuse. I knew about the issue basically right away and was able to get an electrician out to check things out and replace the fuse in a couple days. Much faster than waiting a month or more to see the change to my monthly generation summary or electrical bill.